


Client Overview
Phoenix Package Logistics, a US-based logistics provider had been facing a challenge to optimize their overall internal team productivity for some years now. They had tried different automation and performance measurement solutions in the past but that didn’t solve their problem. They realized they had a serious bleed out in terms of resource efficiency and the overall output which was hurting them financially.
Preliminary Analysis
Our initial assessment of the client’s challenges and requirements lead us to study their business model, resource strength, and annual production data sets that helped us narrow down the solutions.
In our initial business analysis phase we
- Studied their previous year’s production charts and established the optimum output that can be achieved with their resource strength.
- Measured and analyzed their previous tools and performance matrices to see what solutions have been tried previously and their results.
- Through complex algorithm simulations, we helped in identifying the key matrices that the client should be monitoring and enhancing to maximize their output.
Solution Offered
We offered to create a customized Analytic dashboard that is powered by Microsoft BI to facilitate the collection and analysis of their overall productivity with specially designed dashboards and report threads that can help them easily track their primary matrices that included the following:
a) Individual-Resource Scanning Productivity
b) Taping Packages Productivity
c) Total Packages Processed Through Cubiscan per hour
The Additional Solutions For a More Customized Experience
Besides enabling the client with analytics for their primary matrices we also recommended the following add-ons that would help make their production optimization and assessment more time and cost-effective.
a) All-inclusive delivery cost per package calculator measured in real-time
b) Stop Invoice management dashboard to track all transactions and receivables from one dashboard
c) Customizable Data Set and Report visualizations for easy understanding and reporting of complex data points.
The Final Product
In 3 Months we were successful in creating the initial build with the primary data tracking features that were launched in the beta phase for internal testing. The beta launch was important for us to understand the accuracy and consistency of the data that was being computed on the dashboard.
Productivity Scanner Report
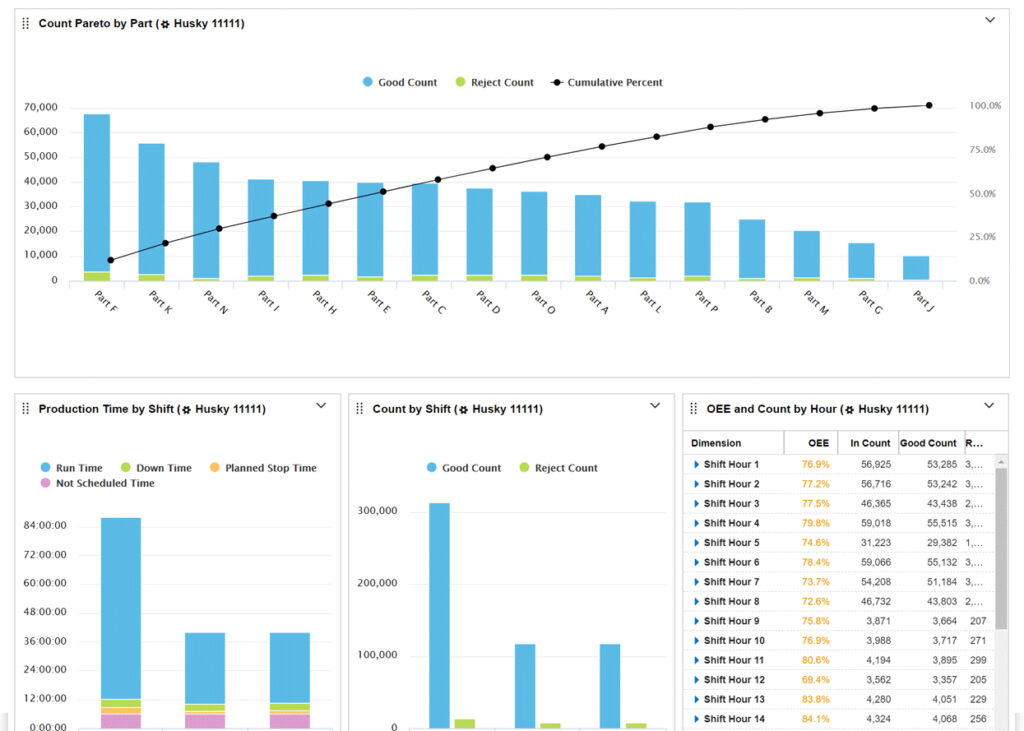
In the Productivity Scanner Report, we can showcase the data analysis of package scanning productivity per person every hour. Here the client can set targets of scans per minute and then measure the actual performance of the workers against the targets to make informed decisions on the overall productivity.
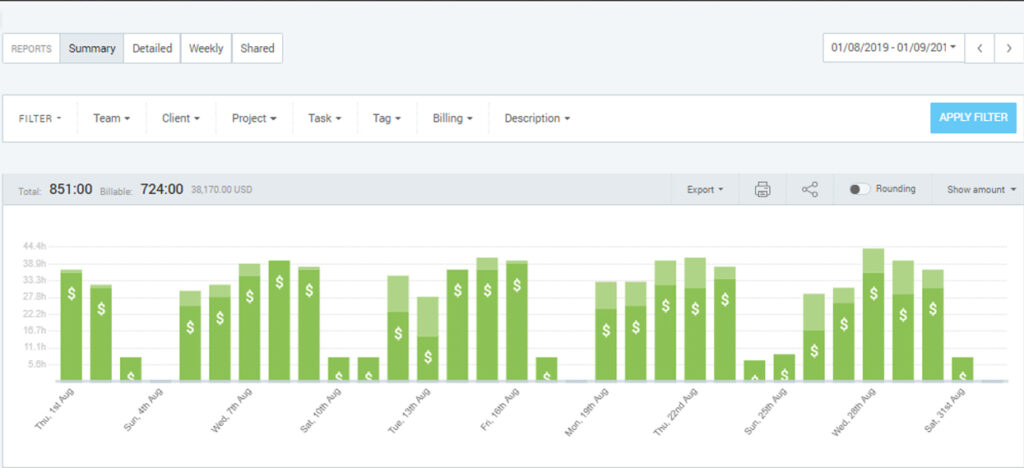
Cost Per Package Analysis

Credit:https://www.goethes-farbenlehre.com/
In this report, the client can calculate the overall cost that is incurred for packaging a complete product. The matrices included can range from
a) Packages scanned
b) Hours took by employees to complete
c) Set target cost per package
d) Calculation & analysis of cost per package
Overtime Report for Employees
Our Analytics tool also helps the client calculate the overtime any employee has put in, in order to complete a task that can be measured across a rolling 12-week reporting system.
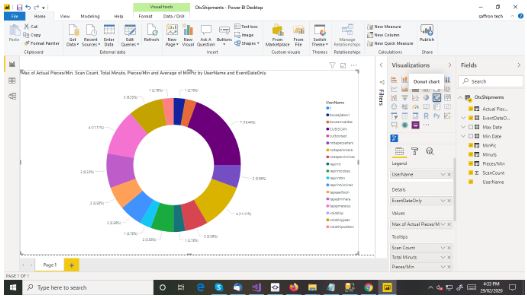
Delivery Performance Analysis
Credit:https://medium.com/@rajabalaji_mp/how-to-use-microsoft-power-bi-b40de114de86
Our client can also calculate the performance of delivery for each project segregated based on delivery zone, time is taken, cost per delivery, number of delivery, etc. This helps them monitor & optimize their package delivery system
Parallelly the development for the secondary functions was in constant development by a parallel development team in order to ensure a streamlined execution for the final launch.
Currently, we have successfully launched the desktop version of the PPL Analytics Dashboard and are working on creating a cross-platform application for the same.